Publications
2023
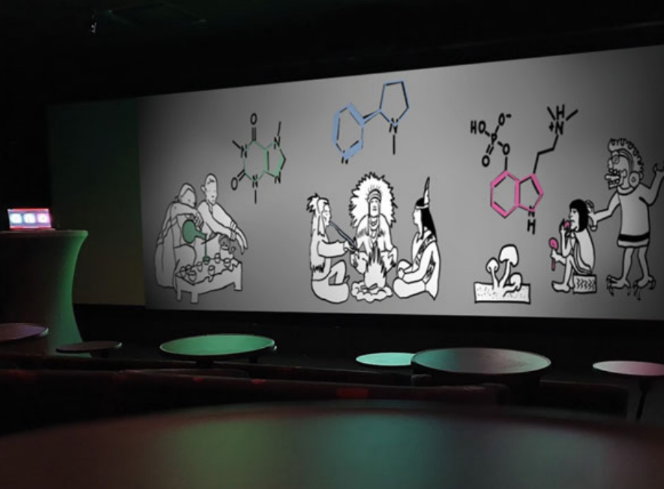
Effect of the Rings: A Visual Story Design Comparing Three Chemical Characters
Hana Pokojná, Farhan Rasheed, Konrad J. Shönborn
Biomedical Visualization
10.1007/978-3-031-41652-1_6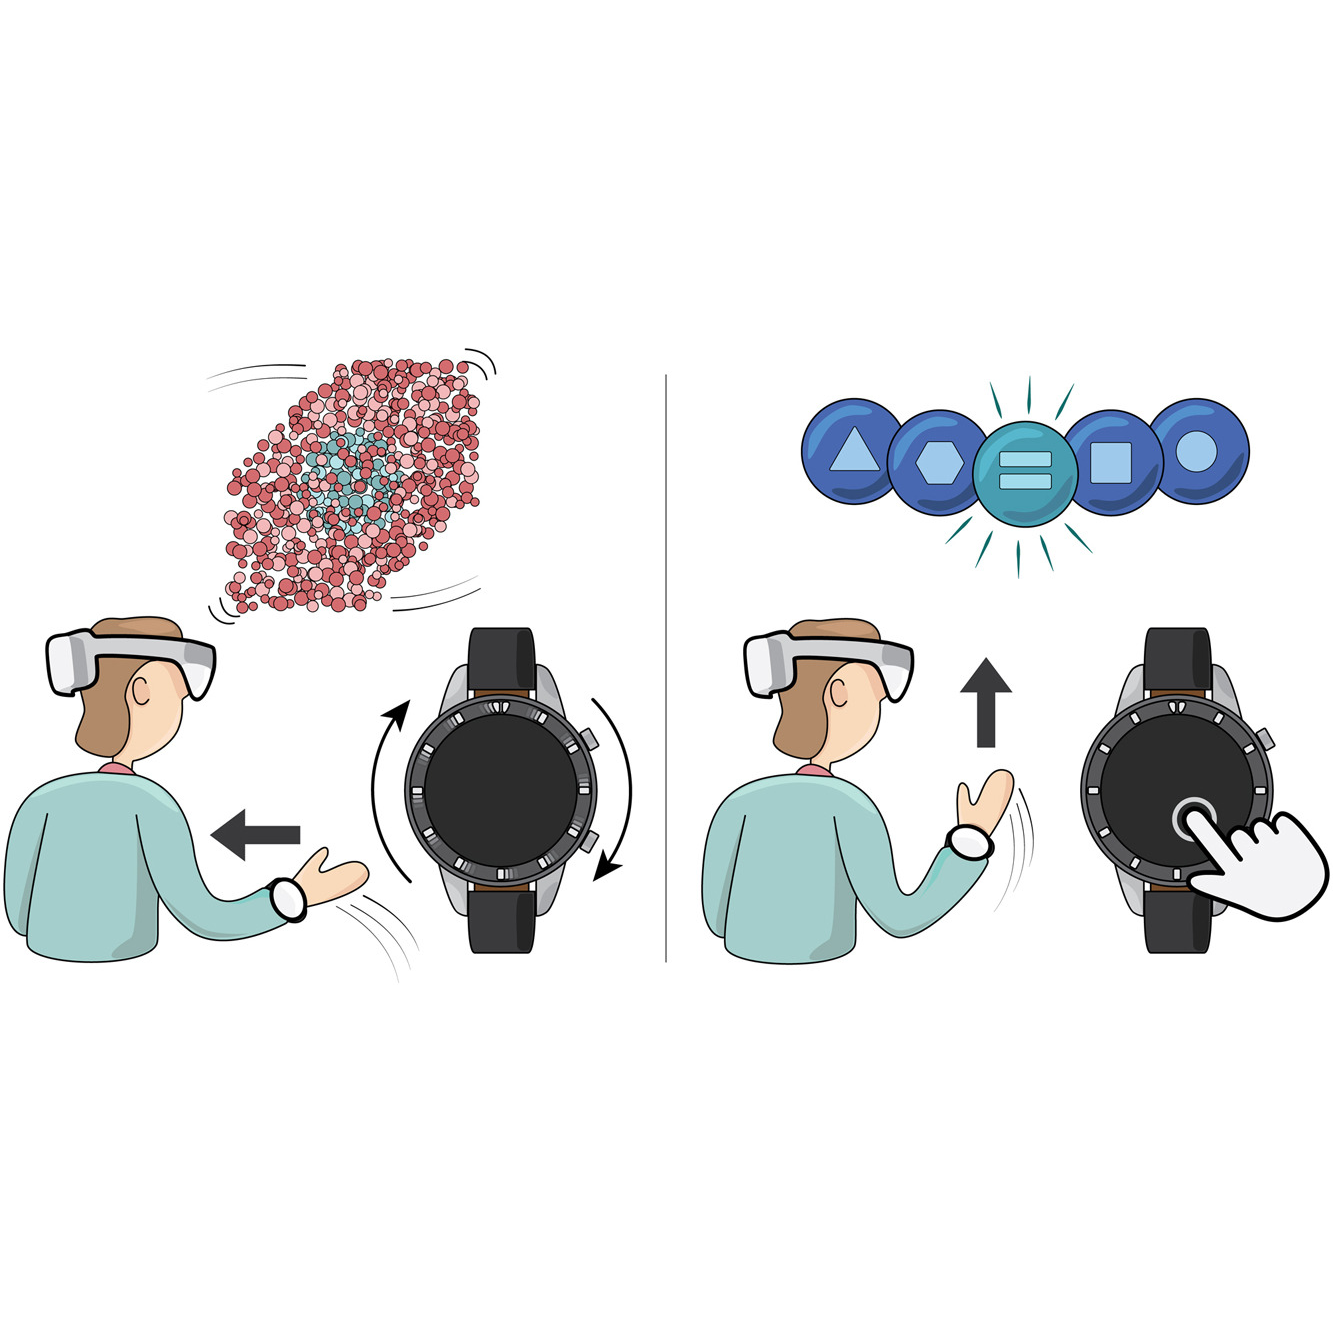
A multimodal smartwatch-based interaction concept for immersive environments
Matěj Lang, Clemens Strobel, Felix Weckesser, Danielle Langlois, Enkelejda Kasneci, Barbora Kozlíková, Michael Krone
Computers & Graphics
10.1016/j.cag.2023.10.010
Seeing the unseen: Comparison study of representation approaches for biochemical processes in education
Hana Pokojná, Barbora Kozlíková, Drew Berry, Simone Kriglstein, Katarína Furmanová
PLoS ONE
10.1371/journal.pone.0293592
xOpat: eXplainable Open Pathology Analysis Tool
Jiří Horák, Katarína Furmanová, Barbora Kozlíková, Tomáš Brázdil, Petr Holub, Martin Kačenga, Matej Gallo, Rudolf Nenutil, Jan Byška, Vít Rusňák
Computer Graphics Forum
10.1111/cgf.14812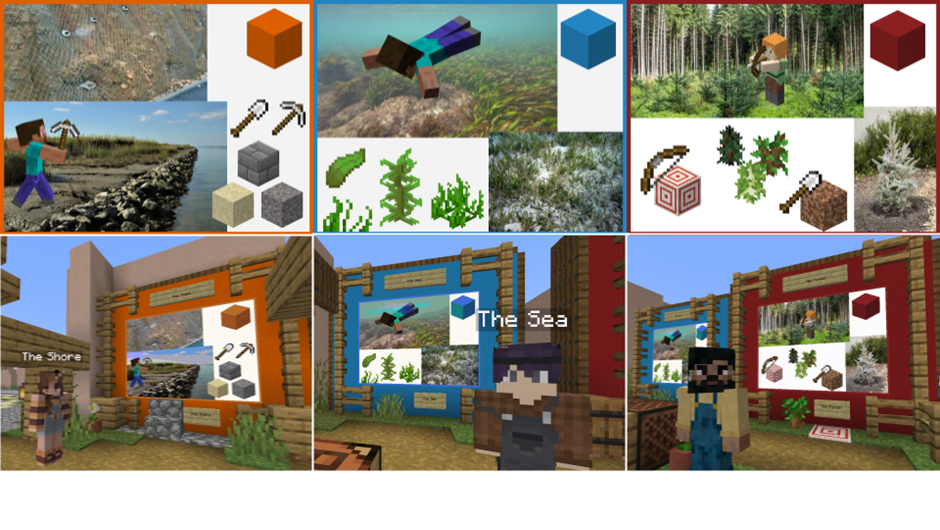
EbAcraft: Engaging Local Communities in Learning About Ecosystem-Based Adaptation for Coastal Cities in Europe
Ítalo de Sena, Chiara Cocco, Vojtěch Brůža, Pierre Lenicolais, Saul Crowley, Francesco Pilla
IEEE International Conference on e-Science and Grid Computing
10.1109/e-Science58273.2023.10254941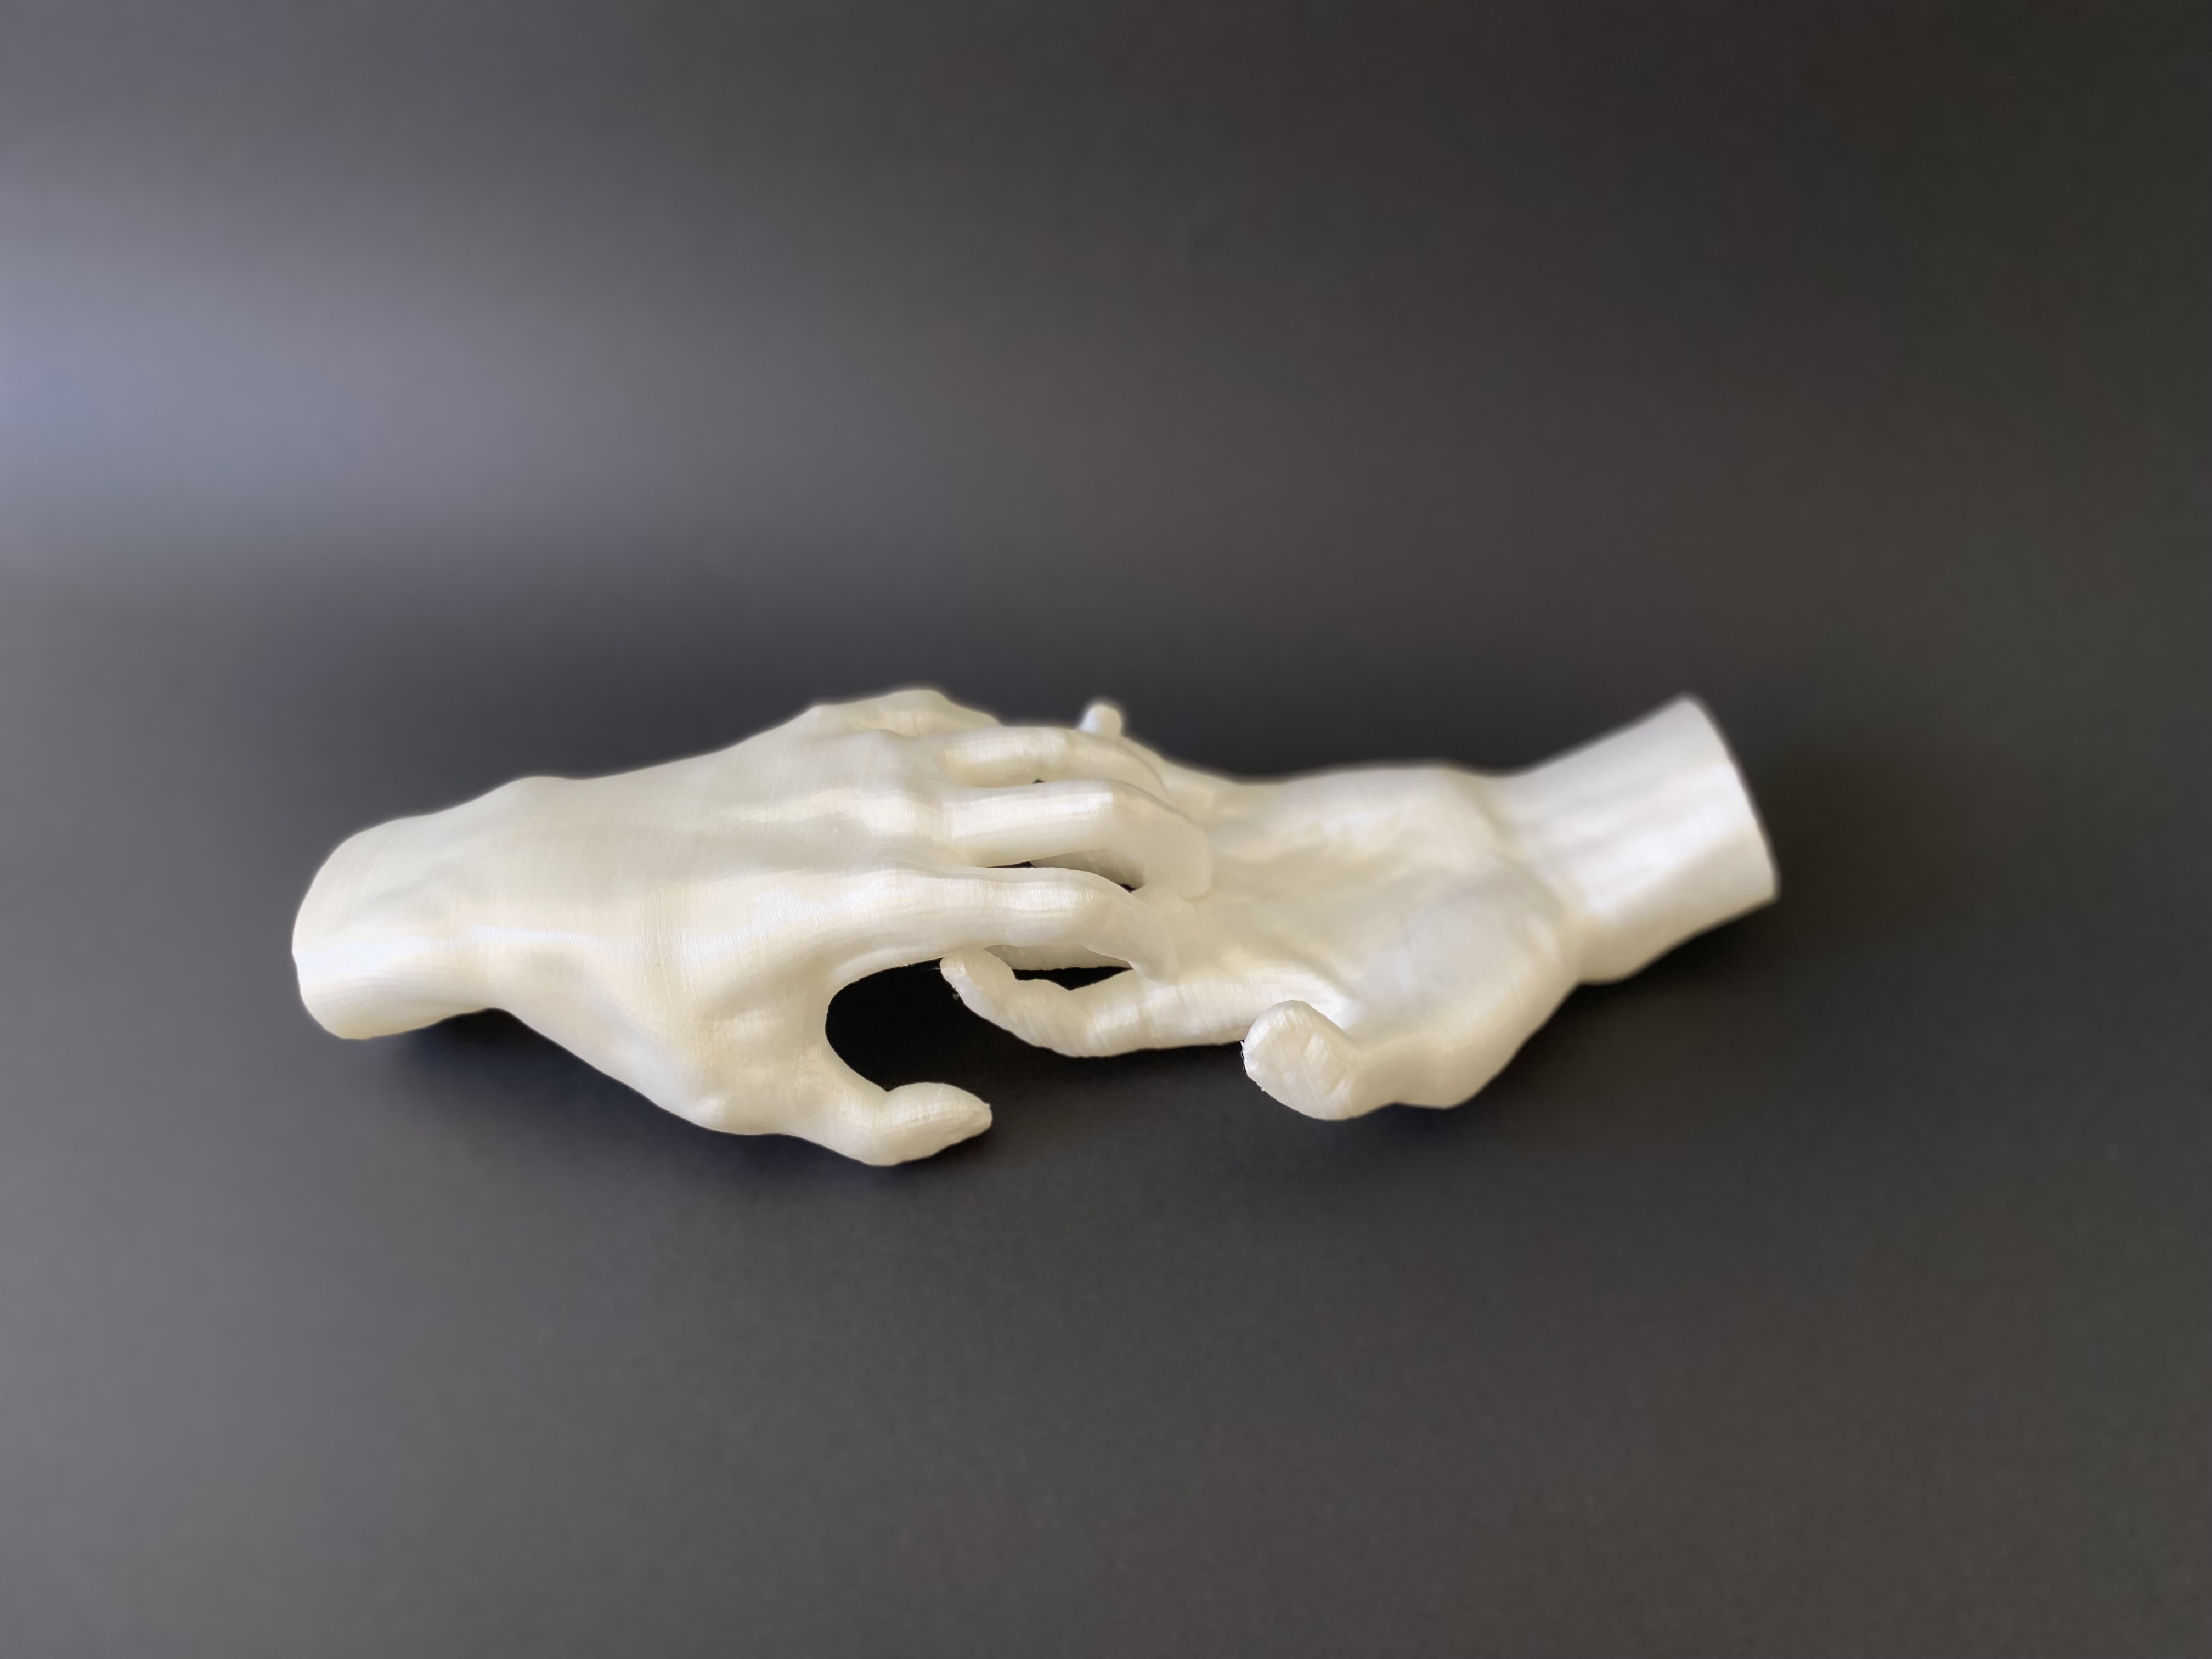
Cartography of Touch: Transformation of touch through anatomical projections
Hana Pokojná
Leonardo
10.1162/leon_a_02403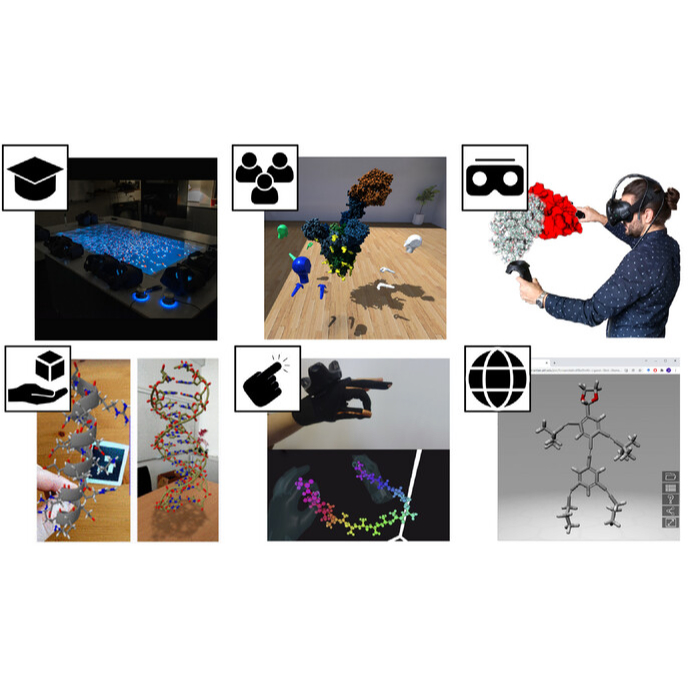
State of the Art of Molecular Visualization in Immersive Virtual Environments
David Kuťák, Pere-Pau Vázquez, Tobias Isenberg, Michael Krone, Marc Baaden, Jan Byška, Barbora Kozlíková, Haichao Miao
Computer Graphics Forum
10.1111/cgf.147382022
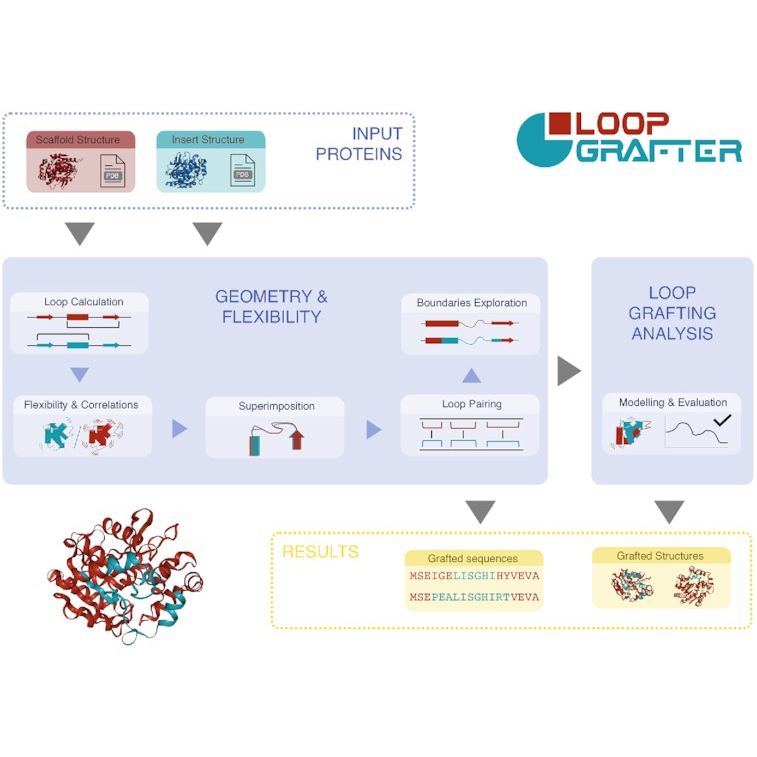
LoopGrafter: a web tool for transplanting dynamical loops for protein engineering
Joan Planas-Iglesias, Filip Opaleny, Pavol Ulbrich, Jan Stourac, Zainab Sanusi, Gaspar P Pinto, Andrea Schenkmayerova, Jan Byska, Jiri Damborsky, Barbora Kozlikova
Nucleic Acids Research
10.1093/nar/gkac249
sMolBoxes: Dataflow Model for Molecular Dynamics Exploration
Pavol Ulbrich, Manuela Waldner, Katarína Furmanová, Sérgio M. Marques, David Bednář, Barbora Kozlíková, Jan Byška
IEEE Transactions on Visualization and Computer Graphics
10.1109/TVCG.2022.3209411The transparent minds: methods of creation of 3D digital models from patient specific data
Hana Pokojná, Caroline Erolin, Christopher Henstridge
Journal of Visual Communication in Medicine
10.1080/17453054.2021.2008230
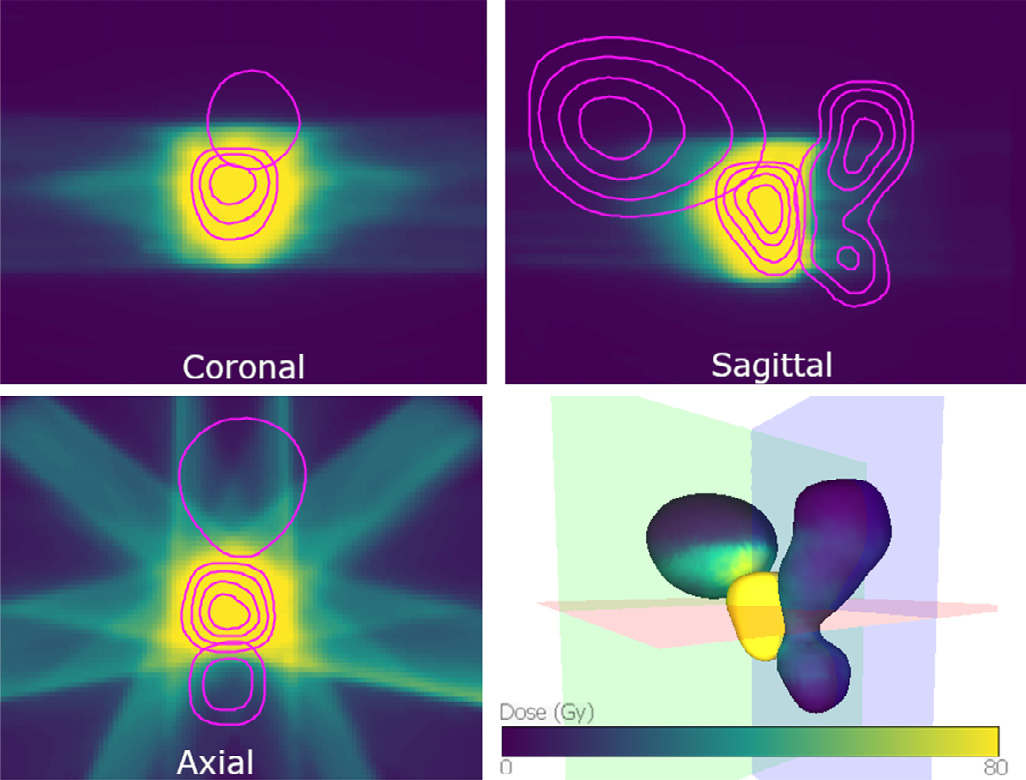
Understanding the impact of statistical and machine learning choices on predictive models for radiotherapy
Ádám Böröndy, Katarína Furmanová, Renata Georgia Raidou
Eurographics Workshop on Visual Computing for Biology and Medicine
10.2312/vcbm.20221188
Vivern – A Virtual Environment for Multiscale Visualization and Modeling of DNA Nanostructures
David Kuťák, Matias Nicolás Selzer, Jan Byška, María Luján Ganuza, Ivan Barišić, Barbora Kozlíková, Haichao Miao
IEEE Transactions on Visualization and Computer Graphics
10.1109/TVCG.2021.3106328
Unified Nanotechnology Format: One Way to Store Them All
David Kuťák, Erik Poppleton, Haichao Miao, Petr Šulc, Ivan Barišić
Molecules
10.3390/molecules27010063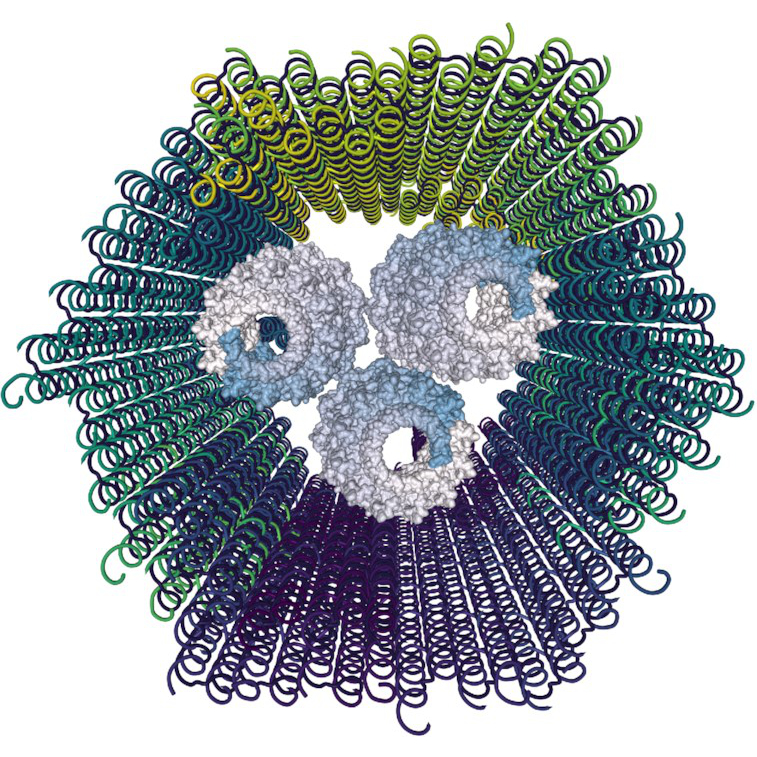
CATANA: an online modelling environment for proteins and nucleic acid nanostructures
David Kuťák, Lucas Melo, Fabian Schroeder, Zoe Jelic-Matošević, Natalie Mutter, Branimir Bertoša, Ivan Barišić
Nucleic Acids Research
10.1093/nar/gkac350
* (This Name Can Be Automatically Generated)
Matěj Lang, Filip Kiraa Opálený, Palko Ulbrich, Lev Nikolajevič
AltVis 2022
https://openreview.net/forum?id=CktC0F4a5DK2021
PREVIS: Predictive visual analytics of anatomical variability for radiotherapy decision support
Katarína Furmanová, Ludvig P. Muren, Oscar Casares-Magaz, Vitali Moiseenko, John P. Einck, Sara Pilskog, Renata G. Raidou
Computers & Graphics
10.1016/j.cag.2021.04.010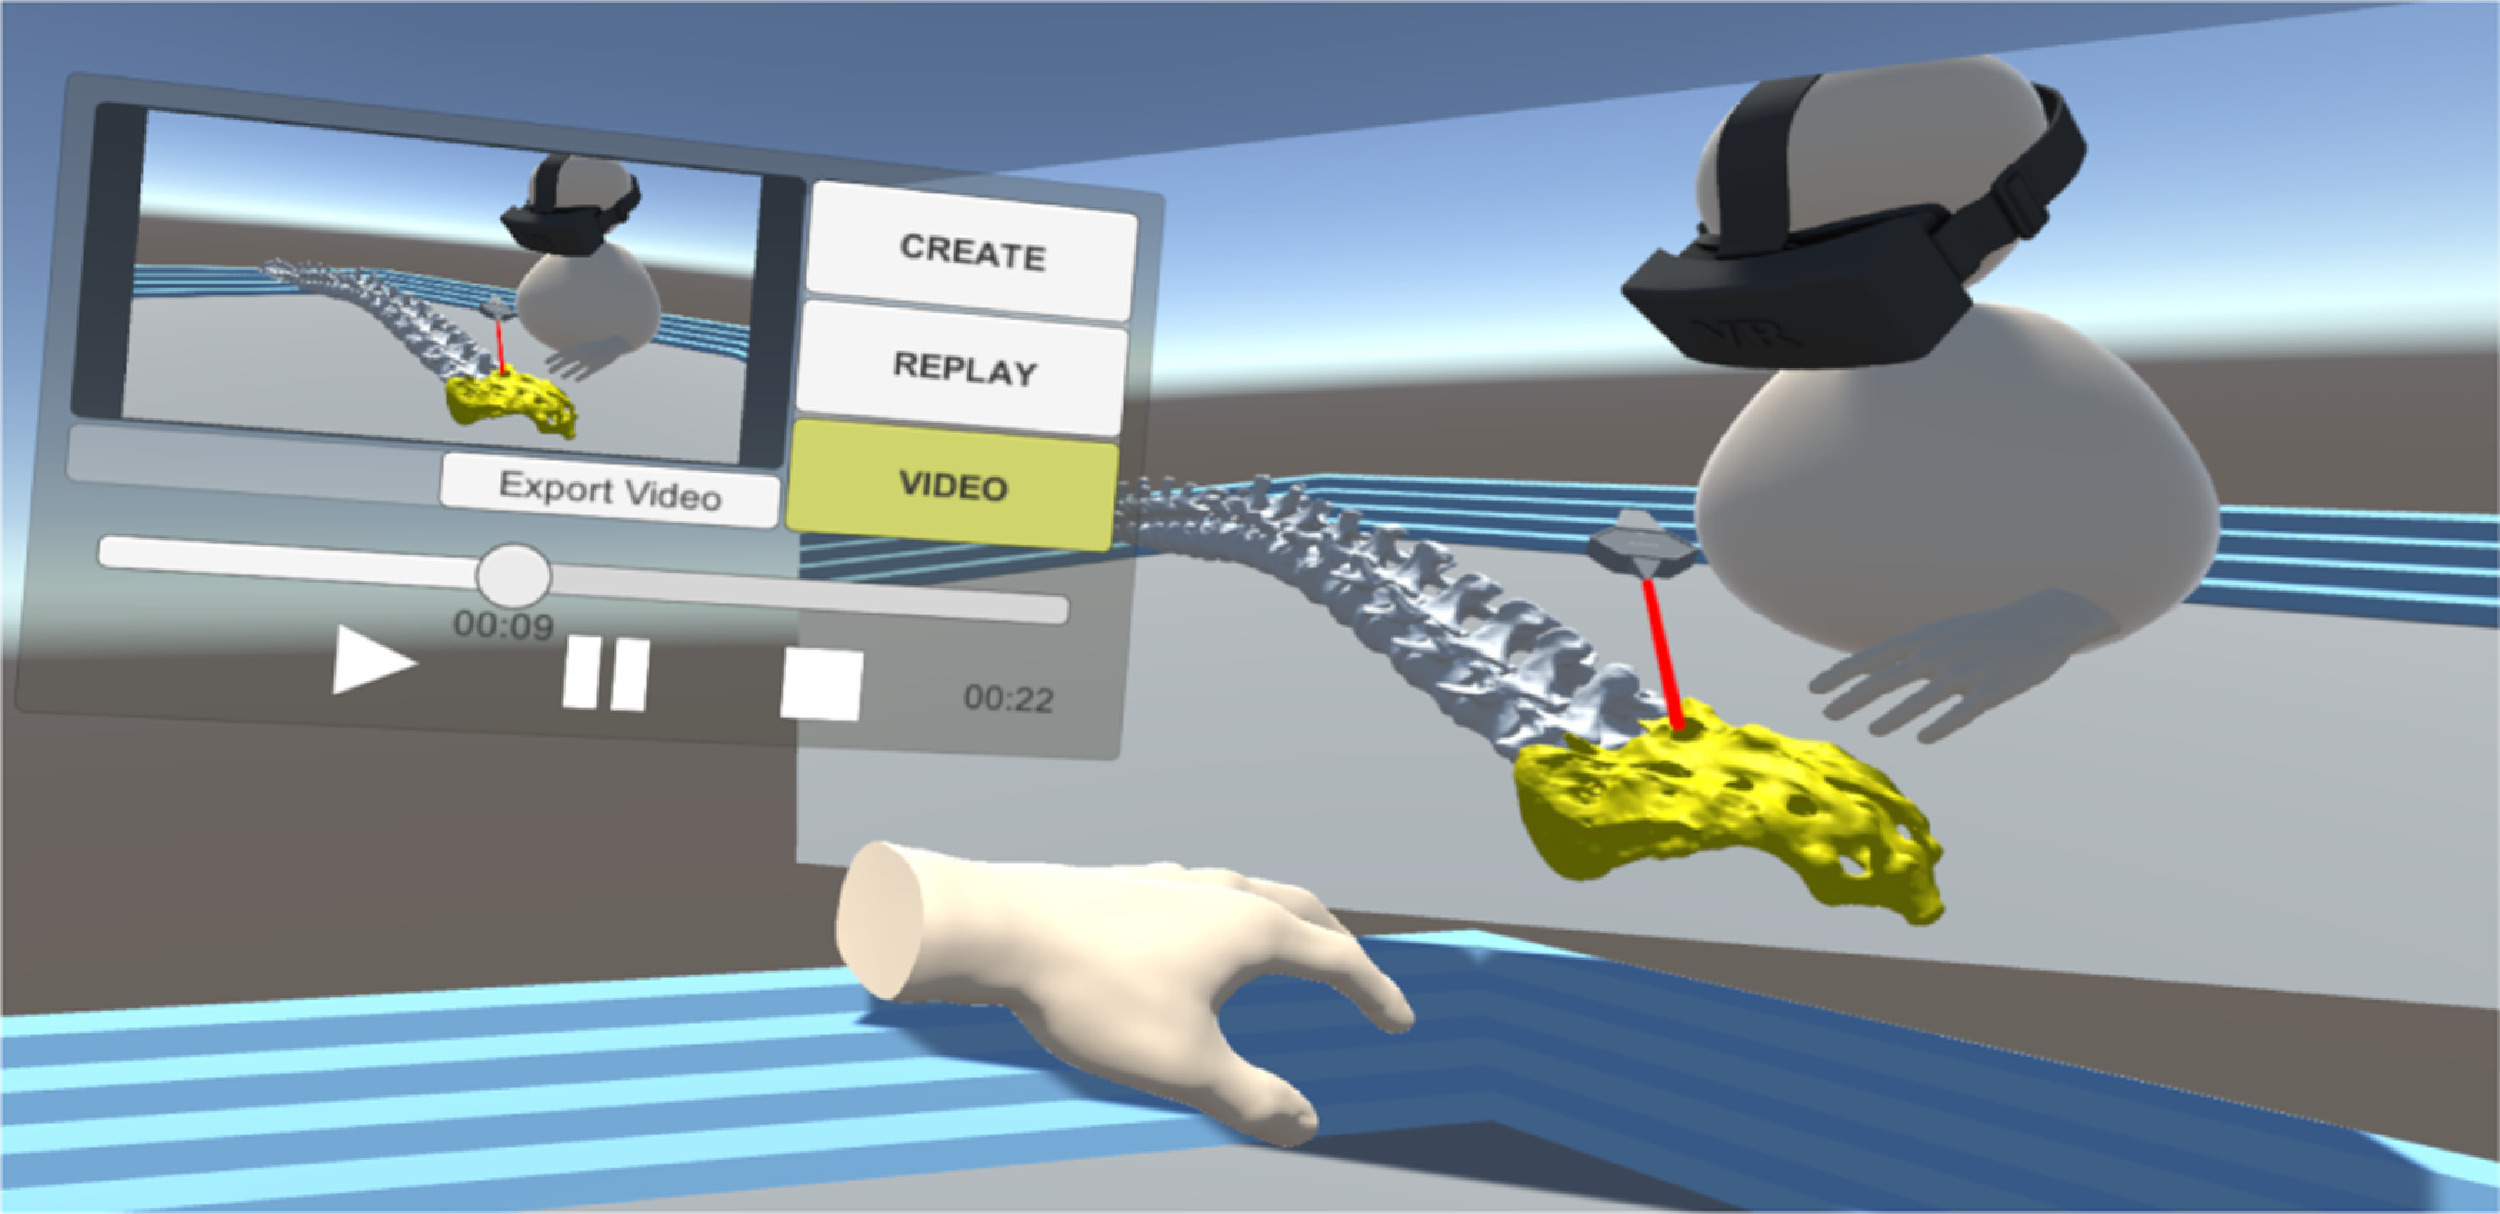
VRdeo: Creating Engaging Educational Material for Asynchronous Student-TeacherExchange Using Virtual Reality
Vojtěch Brůža, Jan Byška Jan Mičan, Barbora Kozlíková
Computers & Graphics
10.1016/j.cag.2021.06.009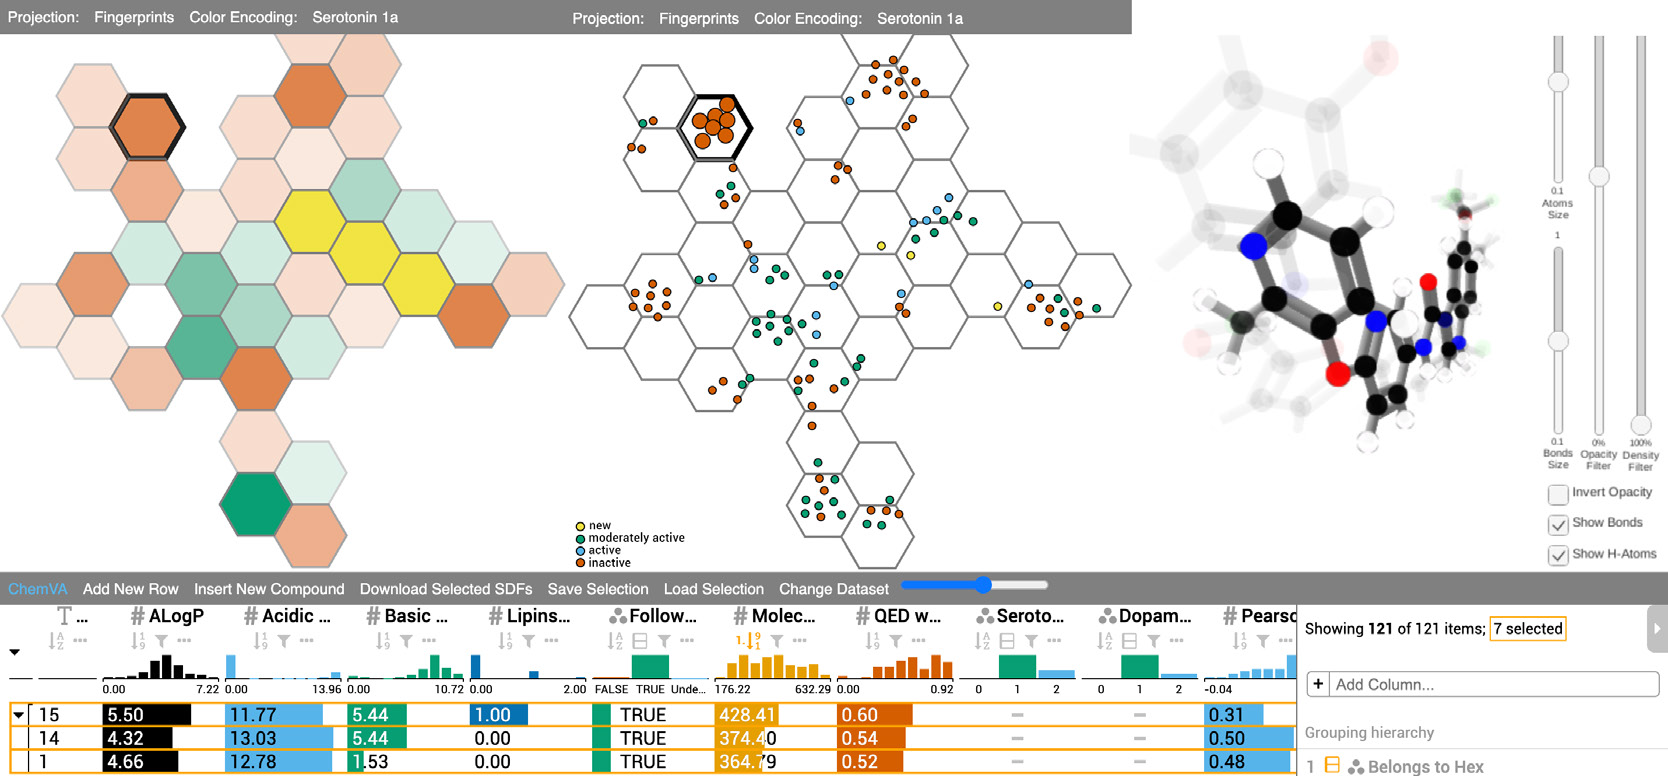
ChemVA: Interactive Visual Analysis of Chemical Compound Similarity in Virtual Screening
María Virginia Sabando, Pavol Ulbrich, Matías Selzer, Jan Byška, Jan Mičan, Ignacio Ponzoni, Axel Soto J., María Luján Ganuza, Barbora Kozlíková
IEEE Transactions on Visualization and Computer Graphics
10.1109/TVCG.2020.30304382020

Intrinsic-Extrinsic Convolution and Pooling for Learning on 3D Protein Structures
Pedro Hermosilla, Marco Schäfer, Matěj Lang, Gloria Fackelmann, Pere Pau Vázquez, Barbora Kozlíková, Michael Krone, Tobias Ritschel, Timo Ropinski
ICLR
10.48550/arXiv.2007.06252Dynamics-function relationship in the catalytic domains of N-terminal acetyltransferases
Angèle Abboud, Pierre Bédoucha, Jan Byška, Thomas Arnesen, Nathalie Reuter
Computational and Structural Biology Journal
10.1016/j.csbj.2020.02.017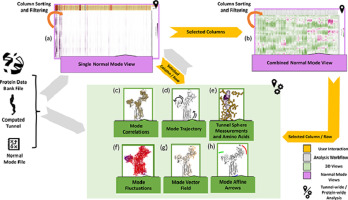
Visual exploration of large normal mode spaces to study protein flexibility
Pierre Bedoucha, Nathalie Reuter, Helwig Hauser, Jan Byška
Computer Graphics Forum
10.1016/j.cag.2020.05.025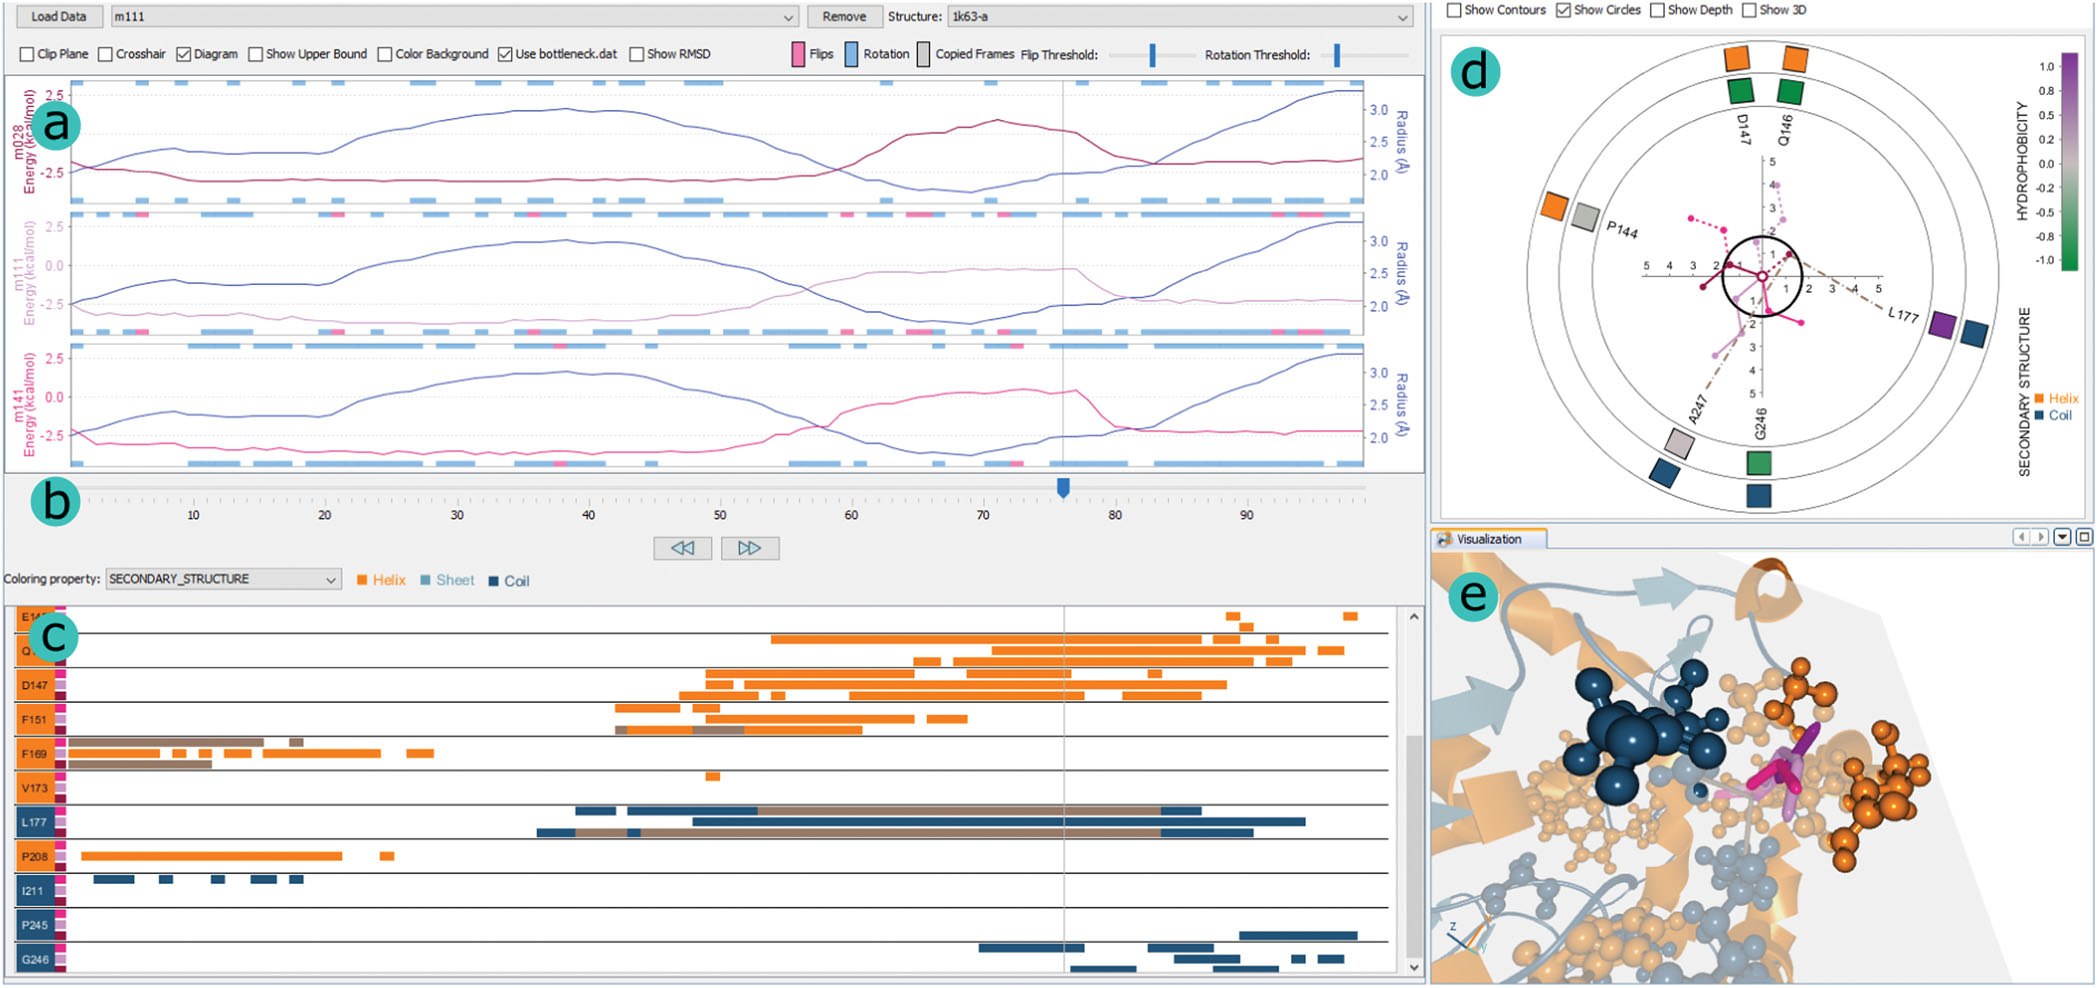
DockVis: Visual Analysis of Molecular Docking Trajectories
Katarína Furmanová, Ondřej Vávra, Barbora Kozlíková, Jiří Damborský, Vojtěch Vonásek, David Bednář, and Jan Byška
Computer Graphics Forum
10.1111/cgf.14048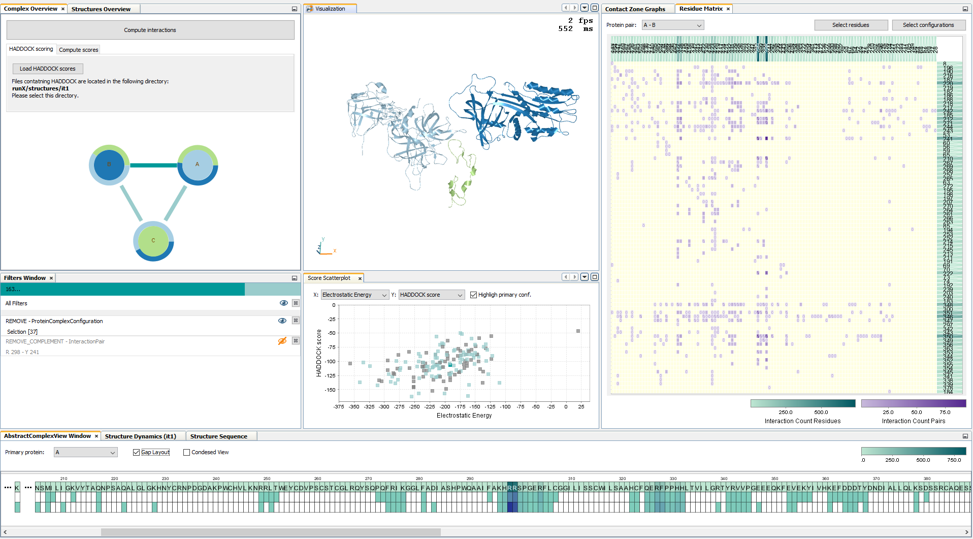
Multiscale Visual Drilldown for the Analysis of Large Ensembles of Multi-Body Protein Complexes
Katarína Furmanová, Adam Jurčík, Barbora Kozlíková, Helwig Hauser and Jan Byška
IEEE Transactions on Visualization and Computer Graphics
10.1109/TVCG.2019.2934333
PINGU: Principles of Interactive Navigation for Geospatial Understanding
Orémuš, Zoltán, Kahin Akram Hassan, Jiří Chmelík, Michaela Kňažková, Jan Byška, Renata Georgia Raidou, and Barbora Kozlíková
IEEE PacificVis 2020
10.1109/PacificVis48177.2020.7567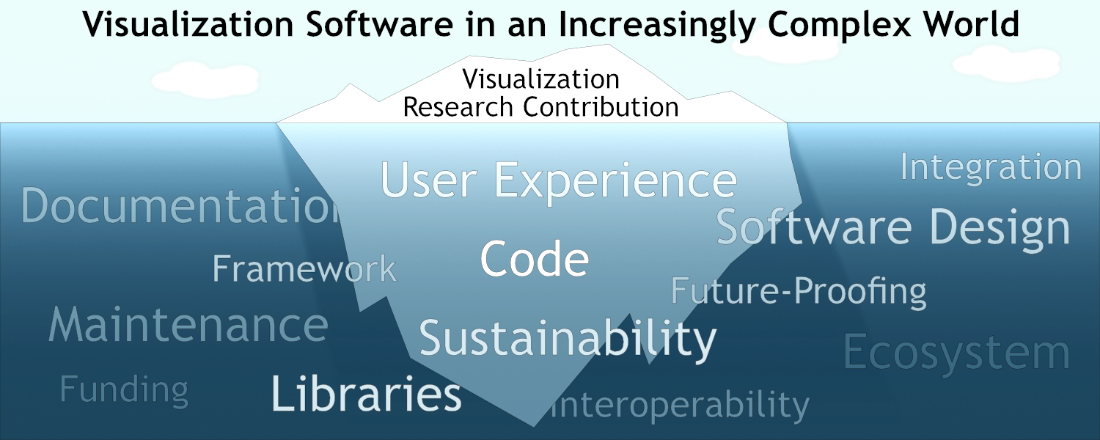
The Moving Target of Visualization Software for an Ever More Complex World
Reina, Guido, Hank Childs, Krešimir Matković, Katja Bühler, Manuela Waldner, David Pugmire, Barbora Kozlíková, Timo Ropinski, Patric Ljung, Takayuki Itoh, Eduard Gröller, and Michael Krone
Computers & Graphics
10.1016/j.cag.2020.01.005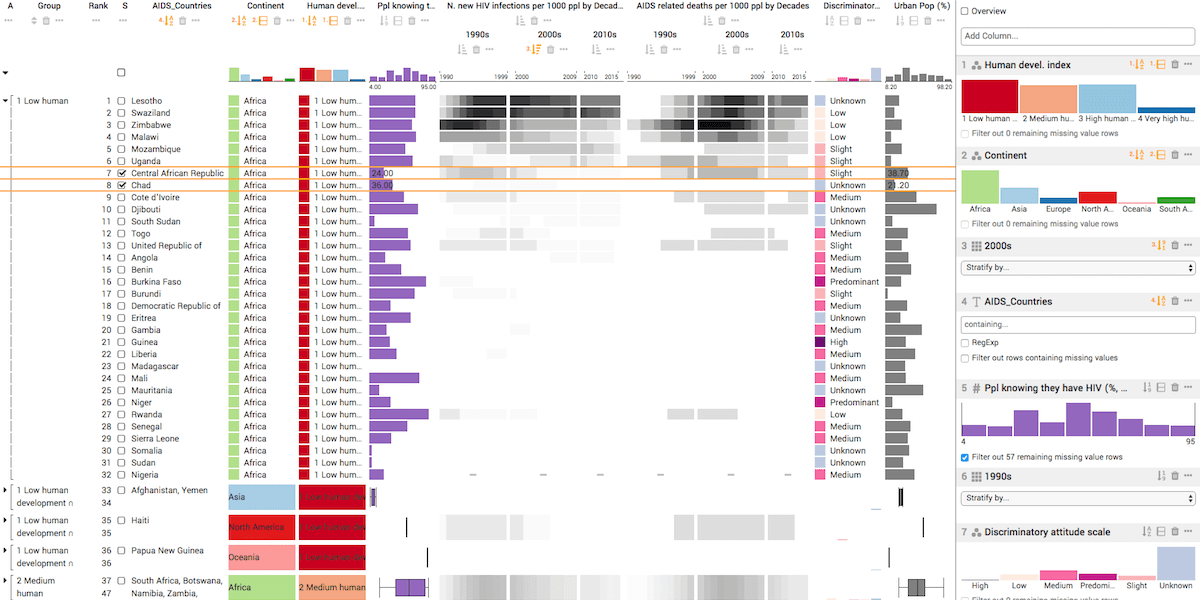
Taggle: Scalable Visualization of Tabular Data through Aggregation
Katarína Furmanová, Samuel Gratzl, Holger Stitz, Thomas Zichner, Miroslava Jarešová, Alexander Lex, Marc Streit
Information Visualization
10.1177/14738716198780852019
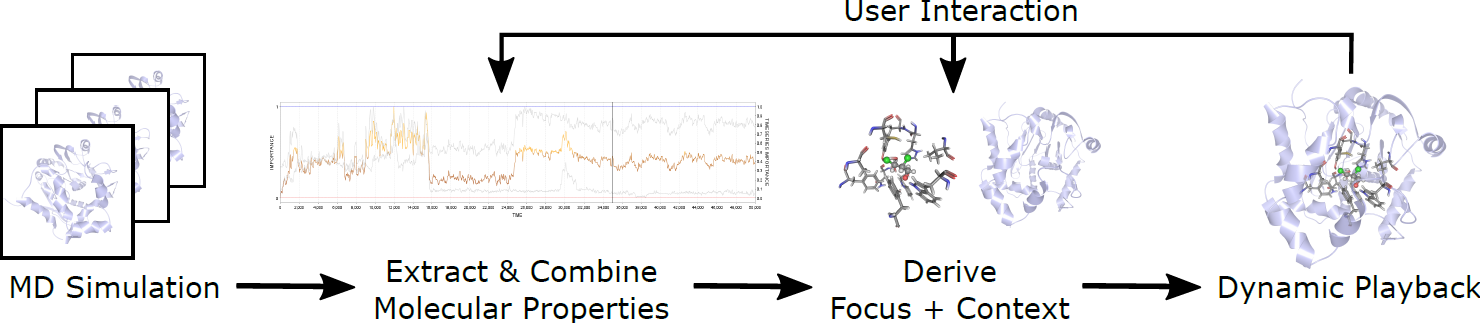
Analysis of Long Molecular Dynamics Simulations Using Interactive Focus+Context Visualization
Jan Byška, Thomas Trautner, Sérgio Manuel Marques, Jiří Damborský, Barbora Kozlíková, Manuela Waldner
Computer Graphics Forum
10.1111/cgf.13701
DockVis: Visual Analysis of Molecular Docking Data
Katarína Furmanová, Barbora Kozlíková, Vojtěch Vonásek, Jan Byška
Eurographics Workshop on Visual Computing for Biology and Medicine
10.2312/vcbm.20191238
Labels on Levels: Labeling of Multi-Scale Multi-Instance and Crowded 3D Biological Environments
David Kouřil, Ladislav Čmolík, Barbora Kozlíková, Hsiang-Yun Wu, Graham Johnson, David S. Goodsell, Arthur Olson, Eduard M. Groeller, and Ivan Viola
IEEE Transactions on Visualization and Computer Graphics
10.1109/TVCG.2018.2864491
Visualization of Large Molecular Trajectories
Duran, David, Pedro Hermosilla, Timo Ropinski, Barbora Kozlíková, Álvar Vinacua, and Pere-Pau Vazquez
IEEE Transactions on Visualization and Computer Graphics
10.1109/TVCG.2018.2864851
Multiscale Molecular Visualization
Miao, Haichao, Tobias Klein, David Kouřil, Peter Mindek, Karsten Schatz, Eduard M. Gröller, Barbora Kozlíková, Tobias Isenberg, and Ivan Viola
Journal of Molecular Biology
10.1016/j.jmb.2018.09.004
Sampling-based Motion Planning for Tracking Evolution of Dynamic Tunnels in Molecular Dynamics Simulations
Vonásek, Vojtěch, Adam Jurčík, Katarína Furmanová, and Barbora Kozlíková
Journal of Intelligent Robotic Systems
10.1007/s10846-018-0877-6
An Interactive and Multimodal Virtual Mind Map for Future Workplace
David Kuťák, Milan Doležal, Bojan Kerous, Zdenek Eichler, Jiří Vašek, Fotis Liarokapis
Frontiers in ICT
10.3389/fict.2019.000142018
Instant Construction and Visualization of Crowded Biological Environments
Klein, Tobias, Ludovic Autin, Barbora Kozlíková, David S. Goodsell, Arthur Olson, Eduard M. Gröller, and Ivan Viola
IEEE Transactions on Visualization and Computer Graphics
10.1109/TVCG.2017.2744258
COZOID: COntact ZOne IDentifier for visual analysis of protein-protein interactions
Furmanová, Katarína, Jan Byška, Eduard M. Gröller, Ivan Viola, Jan Paleček, and Barbora Kozlíková
BMC Bioinformatics
10.1186/s12859-018-2113-6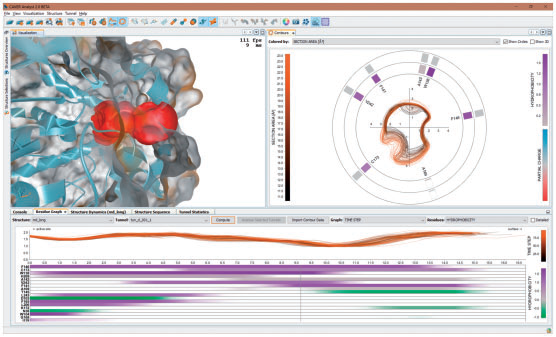
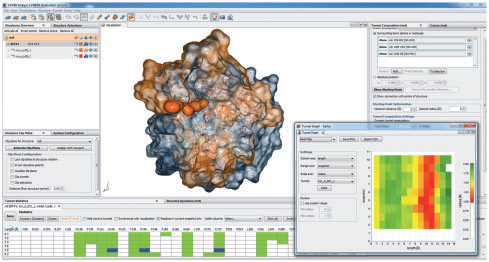
CAVER Analyst 2.0: Analysis and Visualization of Channels and Tunnels in Protein Structures and Molecular Dynamics Trajectories
Jurčík, Adam, David Bednář, Jan Byška, Sérgio Manuel Marques, Katarína Furmanová, Lukáš Daniel, Piia Pauliina Kokkonen, Jan Brezovský, Ondřej Strnad, Jan Štourač, Antonín Pavelka, Martin Maňák, Jiří Damborský, and Barbora Kozlíková
Bioinformatics
10.1093/bioinformatics/bty3862017
Comparative Visualization of Protein Secondary Structures
Kocincová, Lucia, Miroslava Jarešová, Jan Byška, Julius Parulek, Helwig Hauser, and Barbora Kozlíková
BMC Bioinformatics
10.1186/s12859-016-1449-z
Interactive Exploration of Ligand Transportation through Protein Tunnels
Furmanová, Katarína, Miroslava Jarešová, Jan Byška, Adam Jurčík, Julius Parulek, Helwig Hauser, and Barbora Kozlíková
BMC Bioinformatics
10.1186/s12859-016-1448-0
Visualization of Biomolecular Structures: State of the Art Revisited
Kozlíková, Barbora, Michael Krone, Martin Falk, Norbert Lindow, Marc Baaden, Daniel Baum, Ivan Viola, Julius Parulek, and Hans-Christian Hege
Computer Graphics Forum
10.1111/cgf.13072
Watergate: Visual Exploration of Water Trajectories in Protein Dynamics
Vad, Viktor, Jan Byška, Adam Jurčík, Ivan Viola, Eduard M. Gröller, Helwig Hauser, Sérgio Manuel Marques, Jiří Damborský, and Barbora Kozlíková
Eurographics Workshop on Visual Computing for Biology and Medicine
10.2312/vcbm.20171235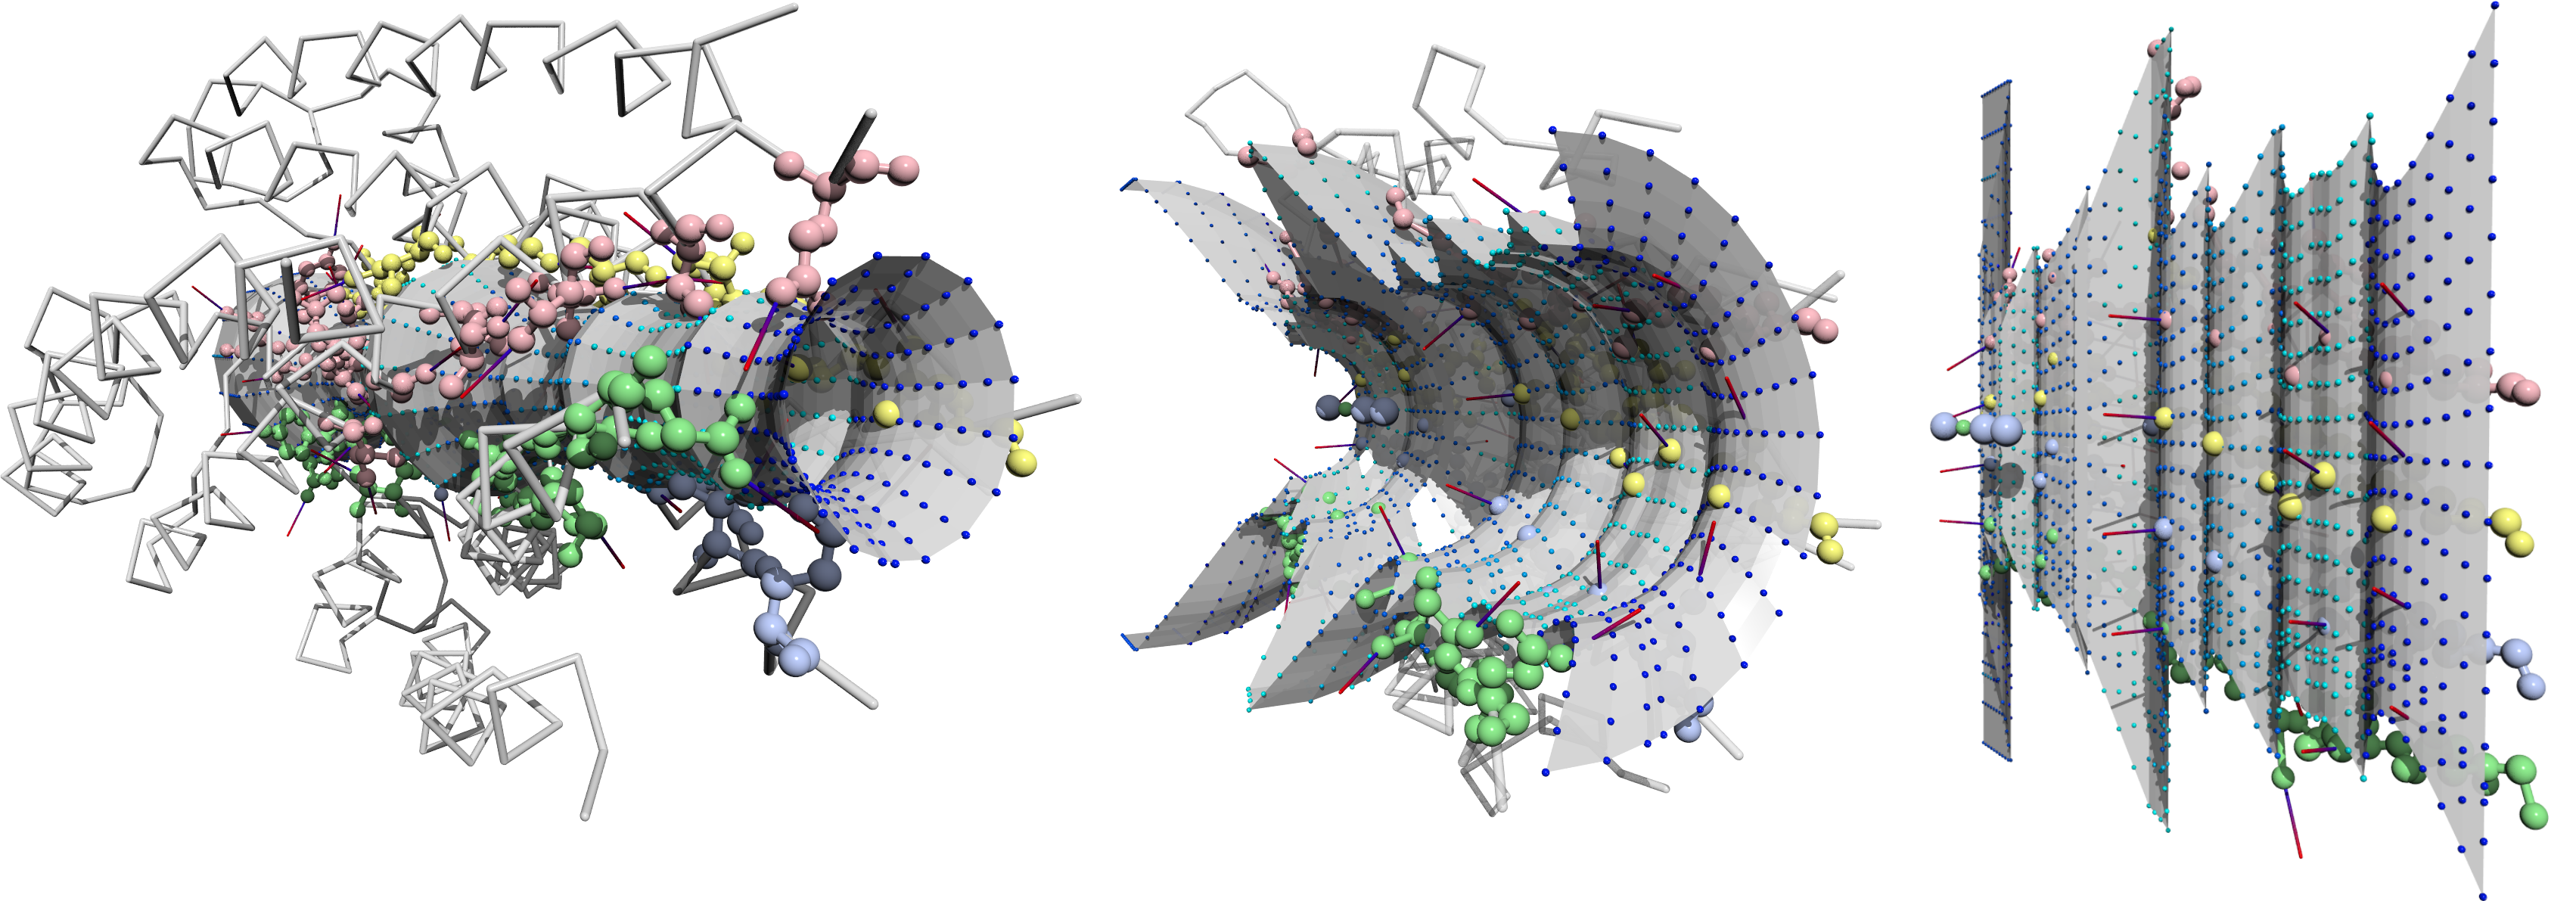
Protein Tunnel Reprojection for Physico-Chemical Property Analysis
Malzahn, Jan, Barbora Kozlíková, and Timo Ropinski
Eurographics Workshop on Visual Computing for Biology and Medicine
10.2312/vcbm.20171231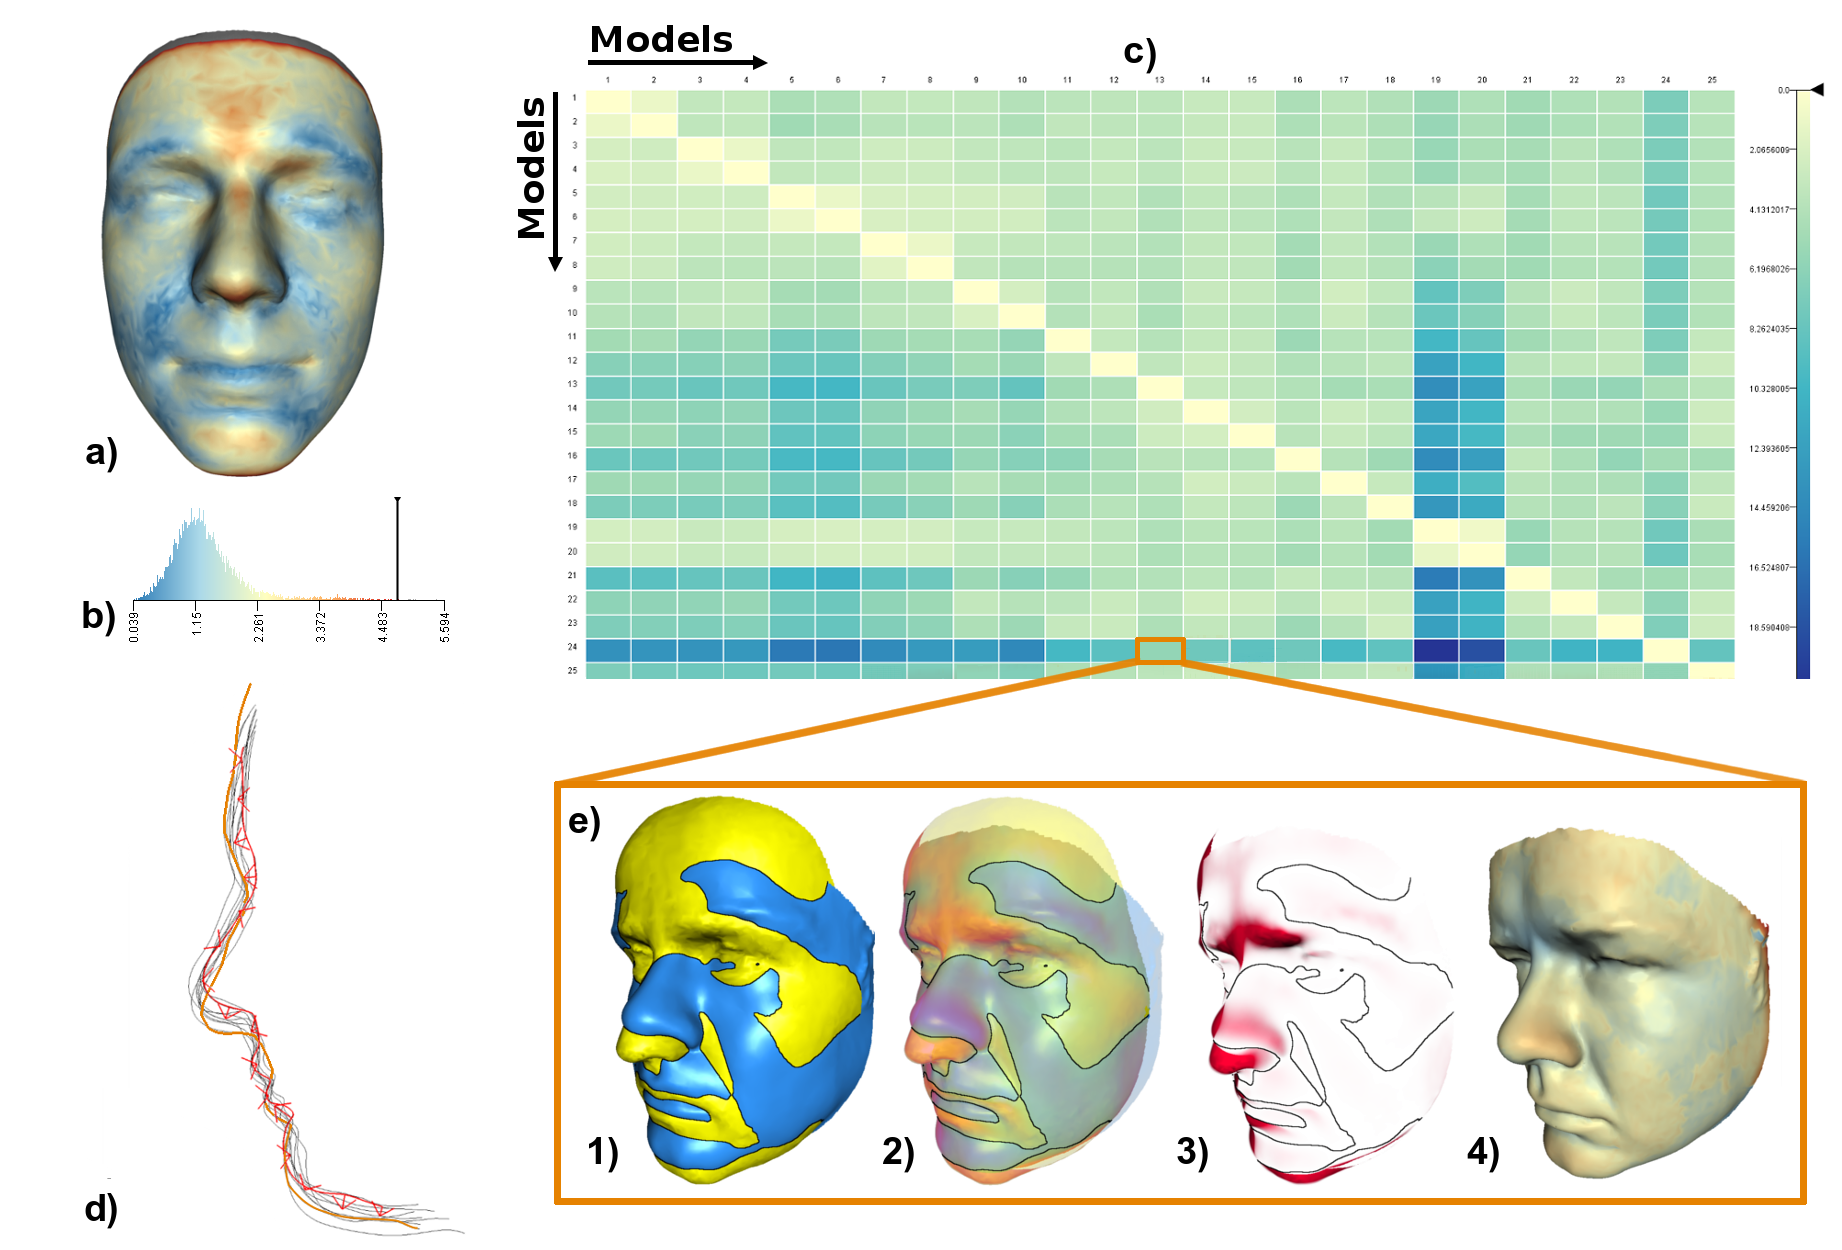
AnthroVis: Visual Analysis of 3D Mesh Ensembles for Forensic Anthropology
Furmanová, Katarína, Petra Urbanová, and Barbora Kozlíková
Proceedings of the 33rd Spring Conference on Computer Graphics
10.1145/3154353.31543632016
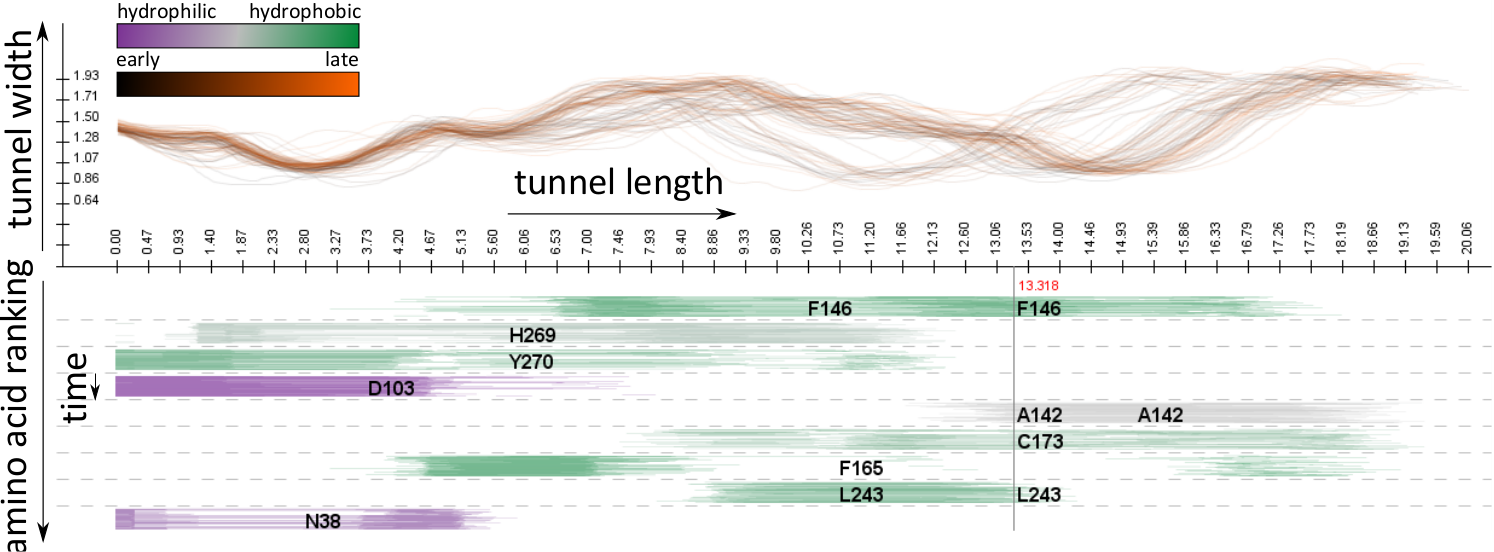
AnimoAminoMiner: Exploration of Protein Tunnels and their Properties in Molecular Dynamics
Byška, Jan, Mathieu Le Muzic, Eduard Gröller, Ivan Viola, and Barbora Kozlíková
IEEE Transactions on Visualization and Computer Graphics
10.1109/TVCG.2015.2467434
CAVER: Algorithms for Analyzing Dynamics of Tunnels in Macromolecules
Pavelka, Antonín, Eva Šebestová, Barbora Kozlíková, Jan Brezovský, Jiří Sochor, and Jiří Damborský
IEEE/ACM Transactions on Computational Biology and Bioinformatics
10.1109/TCBB.2015.2459680
Accelerated Visualization of Transparent Molecular Surfaces in Molecular Dynamics
Jurčík, Adam, Julius Parulek, Jiří Sochor, and Barbora Kozlíková
IEEE Pacific Visualization Symposium 2016
10.1109/PACIFICVIS.2016.7465258
Visual Analysis of Biomolecular Cavities: State of the Art
Krone, Michael, Barbora Kozlíková, Norbert Lindow, Marc Baaden, Daniel Baum, Julius Parulek, Hans-Christian Hege, and Ivan Viola
Computer Graphics Forum
10.1111/cgf.12928
Application of Sampling-based Path Planning for Tunnel Detection in Dynamic Protein Structures
Vonásek, Vojtěch, and Barbora Kozlíková
MMAR: 21st International Conference on Methods and Models in Automation and Robotics
10.1109/MMAR.2016.7575276
Unfolding and Interactive Exploration of Protein Tunnels and their Dynamics
Kolesár, Ivan, Jan Byška, Julius Parulek, Helwig Hauser, and Barbora Kozlíková
EG VCBM 2016 Eurographics Workshop on Visual Computing for Biology and Medicine
10.2312/vcbm.201612652015
Visibility-Based Approach to Surface Detection of Tunnels in Proteins
Jurčík, Adam, Jan Byška, Jiří Sochor, and Barbora Kozlíková
31st Proceedings of Spring Conference on Computer Graphics
10.1145/2788539.2788548
Path-planning algorithm for transportation of molecules through protein tunnel bottlenecks
Byška, Jan, Ivana Kolingerová, Barbora Kozlíková, and Jiří Sochor
31st Proceedings of Spring Conference on Computer Graphics
10.1145/2788539.2788550
MoleCollar and Tunnel Heat Map Visualizations for Conveying Spatio-Temporo-Chemical Properties Across and Along Protein Voids
Byška, Jan, Adam Jurčík, Eduard M. Gröller, Ivan Viola, and Barbora Kozlíková
Computer Graphics Forum
10.1111/cgf.12612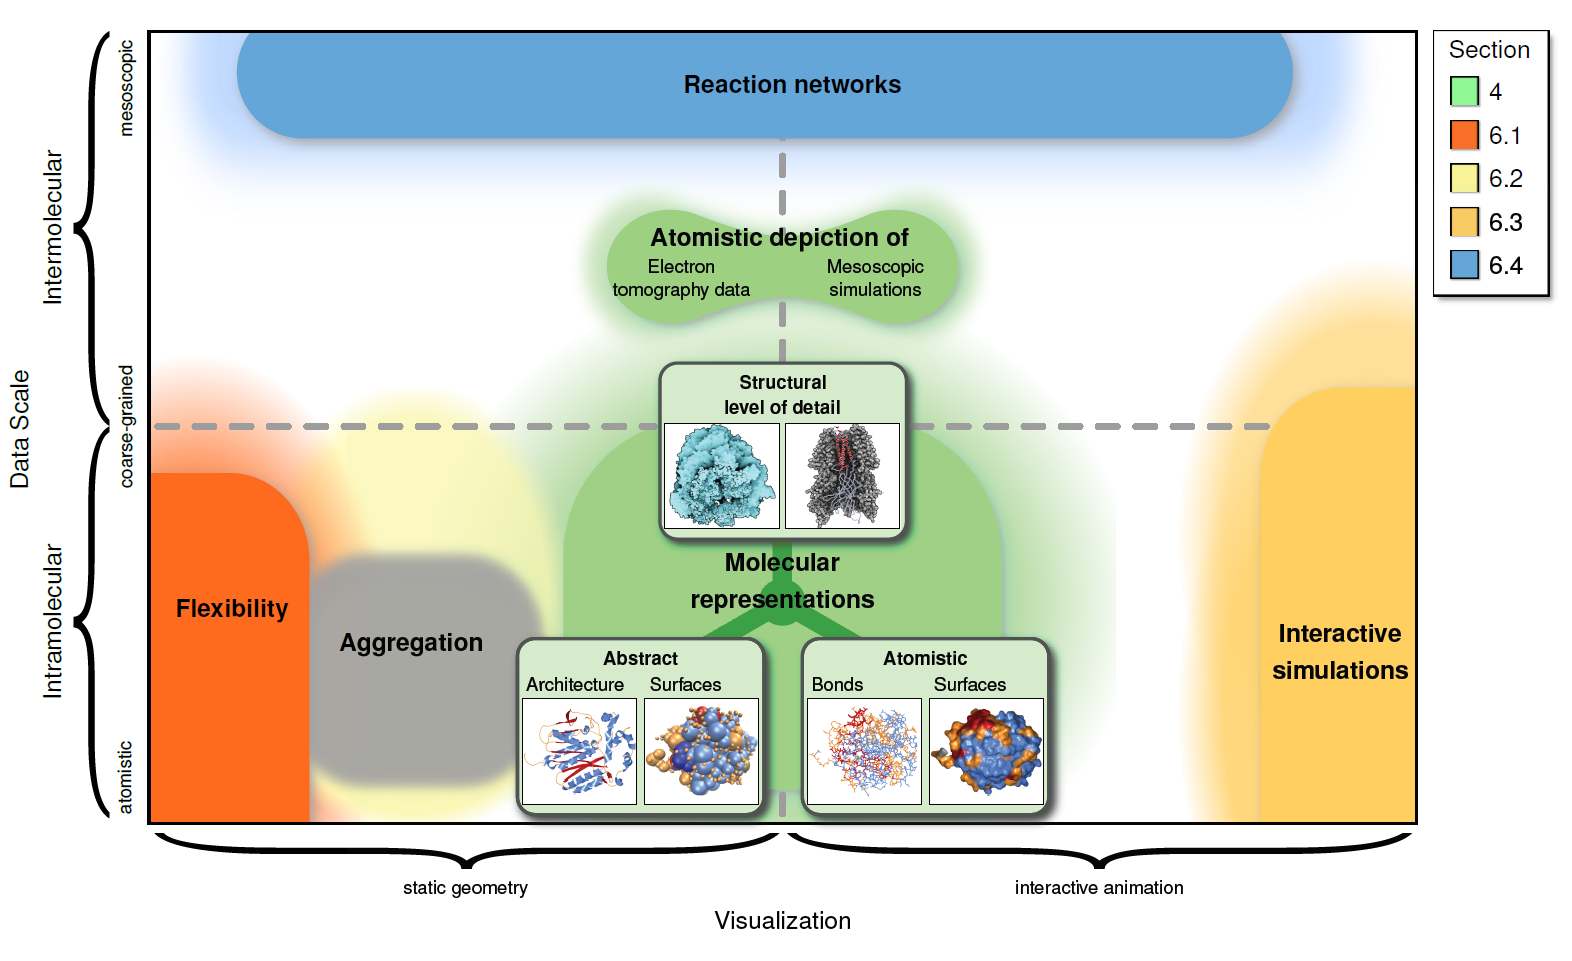
Visualization of Biomolecular Structures: State of the Art
Kozlíková, Barbora, Michael Krone, Norbert Lindow, Martin Falk, Marc Baaden, Daniel Baum, Ivan Viola, Julius Parulek, and Hans-Christian Hege
Eurographics Conference on Visualization (EuroVis) – STARs
10.2312/eurovisstar.201511122014
CAVER Analyst 1.0: Graphic tool for interactive visualization and analysis of tunnels and channels in protein structures
Kozlíková, Barbora, Eva Šebestová, Vilém Šustr, Jan Brezovský, Ondřej Strnad, Lukáš Daniel, David Bednář, Antonín Pavelka, Martin Maňák, Martin Bezděka, Petr Beneš, Matúš Kotry, Artur Wiktor Gora, Jiří Damborský, and Jiří Sochor
Bioinformatics
10.1093/bioinformatics/btu364